Conversational Tactile Data Interfaces: Co-Designing Accessible Data Experiences with Blind Users Using Refreshable Tactile Displays and Conversational AI
Jump to Discussion
Presentation
- Session
- This feels amazingly real!
- Time
- Friday, Nov 13, 08:36 – 08:48 (US/Eastern) · session 08:00 – 09:30
- Room
- Hall America north
- Presenting from
- remote
Links
Sign in to access the Paper PDF.
- Preprint PDF(opens in new tab)
Abstract
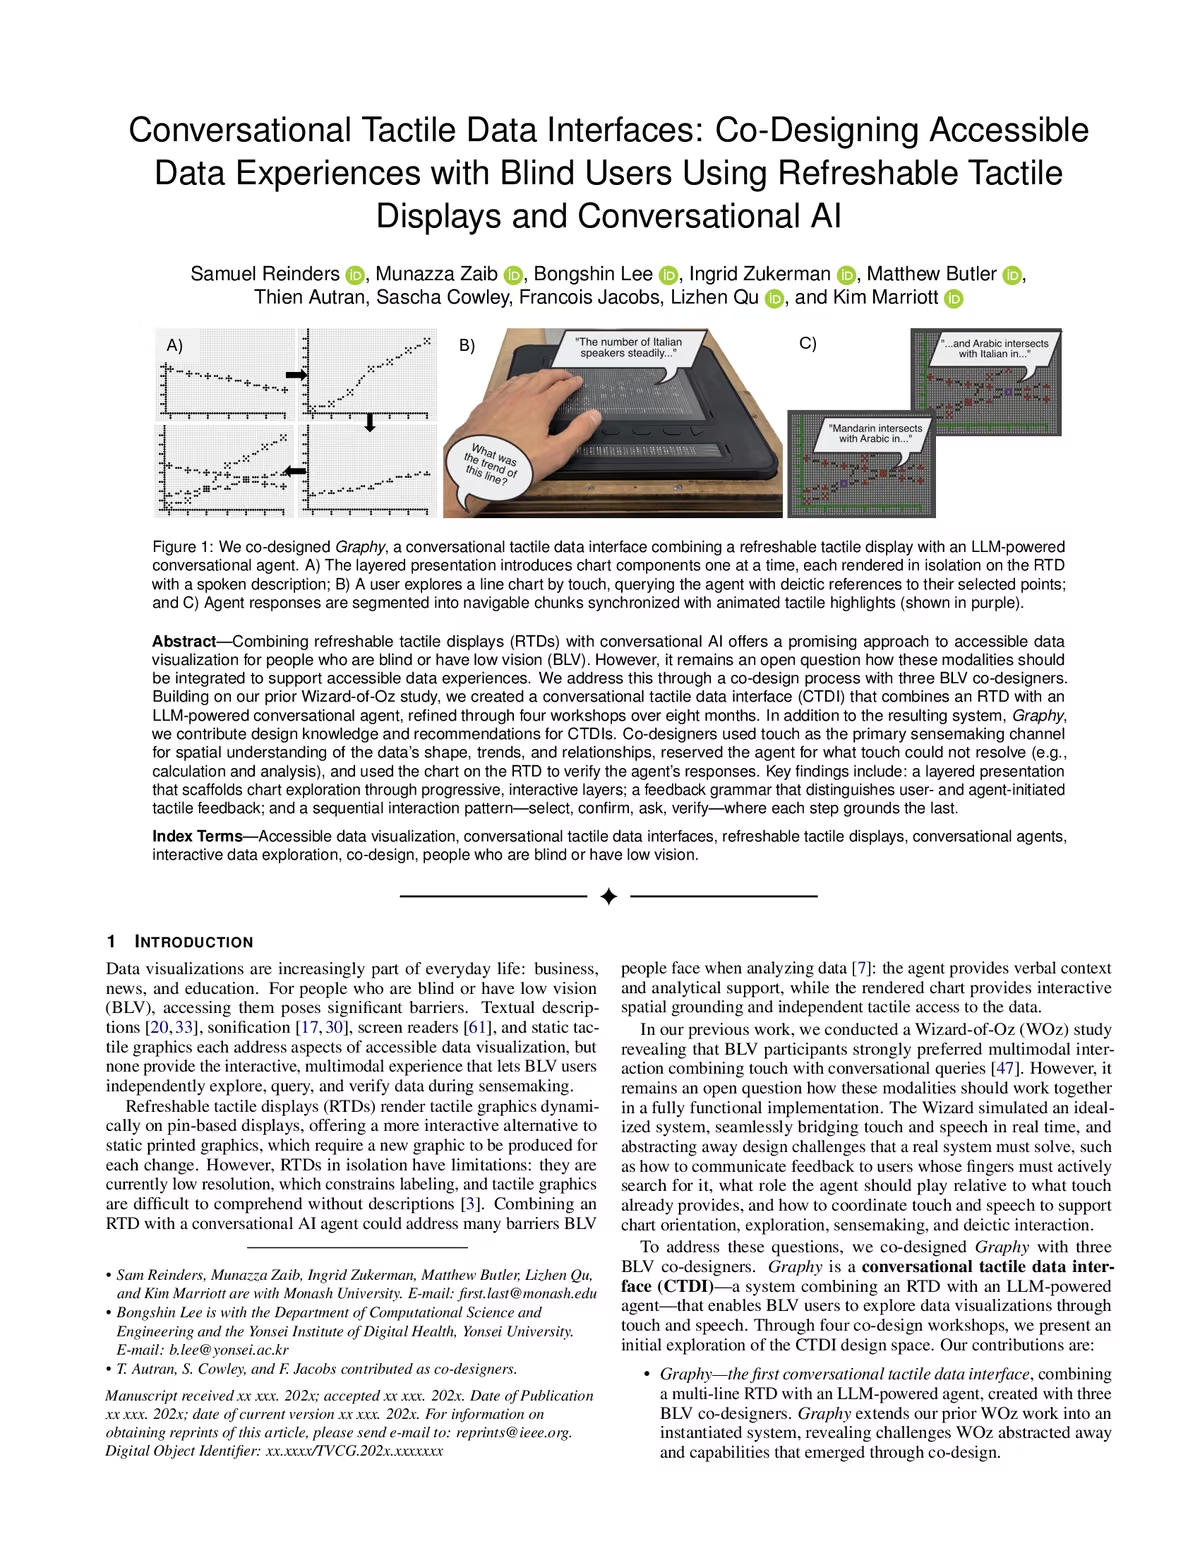
Combining refreshable tactile displays (RTDs) with conversational AI offers a promising approach to accessible data visualization for people who are blind or have low vision (BLV). However, it remains an open question how these modalities should be integrated to support accessible data experiences. We address this through a co-design process with three BLV co-designers. Building on our prior Wizard-of-Oz study, we created a conversational tactile data interface (CTDI) that combines an RTD with an LLM-powered conversational agent, refined through four workshops over eight months. In addition to the resulting system, Graphy, we contribute design knowledge and recommendations for CTDIs. Co-designers used touch as the primary sensemaking channel for spatial understanding of the data’s shape, trends, and relationships, reserved the agent for what touch could not resolve (e.g., calculation and analysis), and used the chart on the RTD to verify the agent’s responses. Key findings include: a layered presentation that scaffolds chart exploration through progressive, interactive layers; a feedback grammar that distinguishes user- and agent-initiated tactile feedback; and a sequential interaction pattern—select, confirm, ask, verify—where each step grounds the last.
For Practitioners
Refreshable tactile displays are becoming more affordable, making them a realistic output medium for visualization, and this paper shows how to make exploring data on them accessible: pairing the display with a conversational agent, and coordinating the two. Visualization tool builders, accessible-visualization designers, assistive-technology developers and display manufacturers will find design guidance and interaction patterns for that coordination: introducing a chart in layers (layered presentation), segmenting agent responses to match what the user is touching, and grounding every answer in a point the user has located (select, confirm, ask, verify).